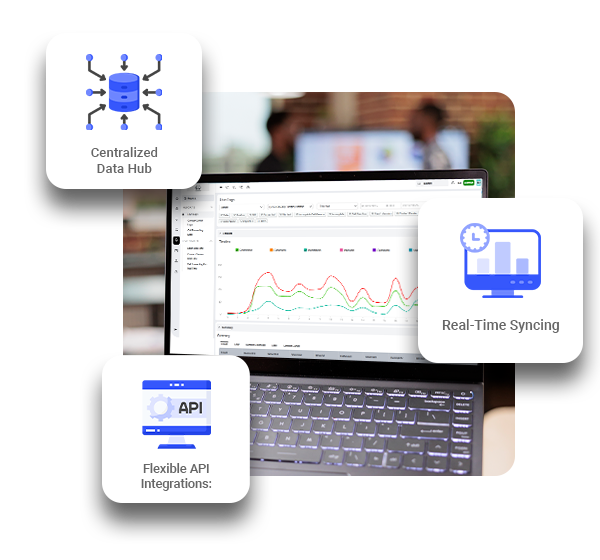
Ringopus offers advanced Reporting and Analytics solutions so that our clients can transform their raw data into actionable information. Reporting and analytics refers to the process of collecting and presenting data and then data interpretation to make decisions. Reporting works on collecting data in charts and tables forms, while analytics involve deep analysis of the data to find patterns, answer specific business questions, and future predictions.
Data can be easier when it is visually represented. Ringopus allows you to transform complex datasets into intuitive, interactive visualizations that make it simple to spot trends and patterns:
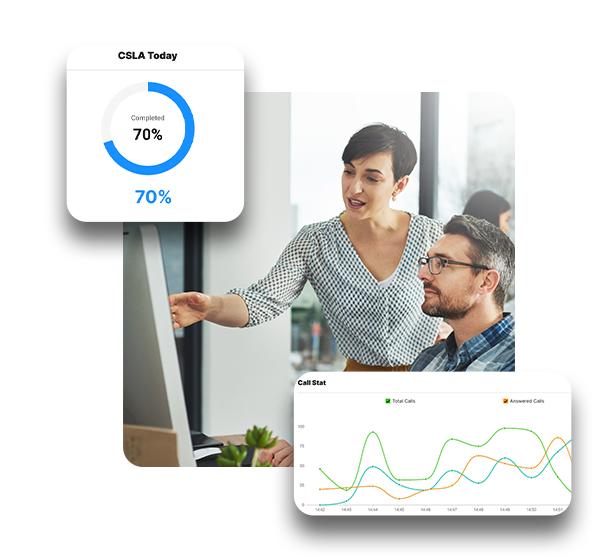
Reporting presents a structured format of gathering and presenting data in the form of graphs, tables, and dashboard. Its primary aim is to show “what happened”. It presents data in a structured way. Analytics act to interpret and analyse organized data to understand patterns, get views and predictions. Its primary aim is to provide explanations about the reason and prediction about data. It answers and offers actionable views after investigating the data.
With a reporting system tenants can easily create customizable, detailed reports that provide a clear picture of performance metrics. Whether you need regular financial reports, sales performance analysis, or operational efficiency tracking, our platform makes it simple to:
Make Custom Reports: Create reports to fulfill your requirements such as filter, sort, and group data depending on various criteria to get proper views.
Self operating Reporting: You can schedule self-operated reports to be sent to your inbox or shared with team members on a regular basis.
Real-Time Dashboards: You can monitor your business performance in real time with interactive, easily readable dashboards.
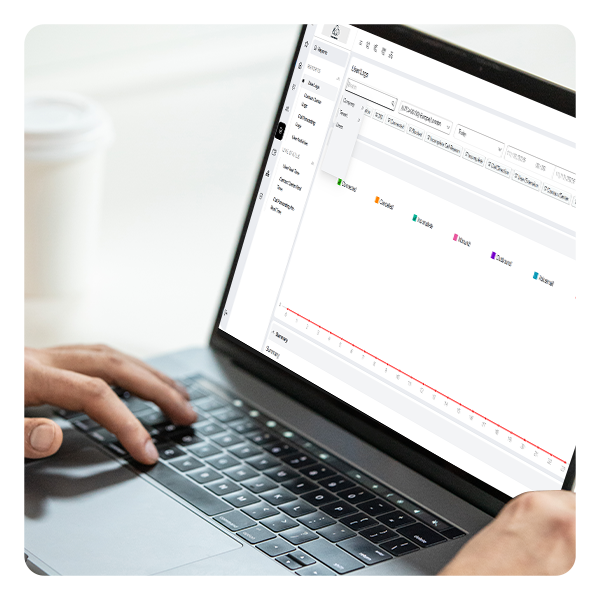
Move beyond basic data tracking with Ringopus’ advanced analytics features. Businesses can perform complete data analysis, get patterns, and predict future updations.
Pattern Analysis: Understand updates in your business data to make informed decisions about future strategies and growth opportunities.
Predictive Analytics: Use advanced algorithms to understand results based on previous data, helping you predict changes and prepare for future conditions.
Division and group Analysis: Divide your data based on user behavior, demographics, or market conditions to get targeted reviews and improve decision-making.
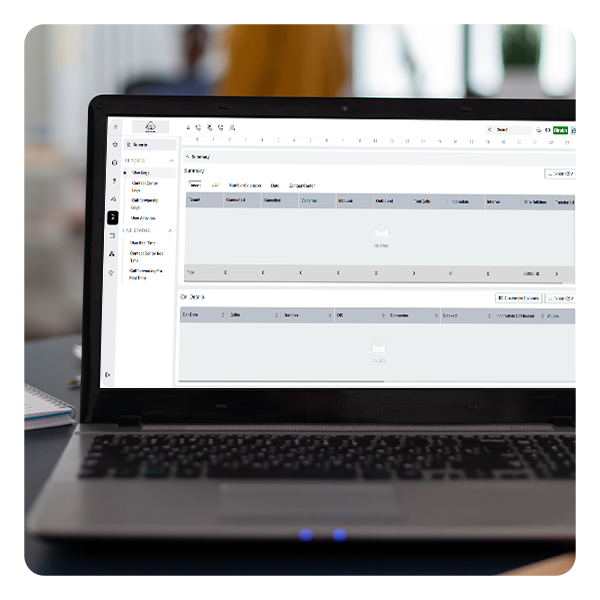
At Ringopus, data should be action-driven . It helps you to show data and also take action based on searches. Our platform provides a comprehensive set of applications to help you track, analyze, and watch your business performance and take smarter decisions and get better results.
Get instant notifications when your metrics hit main limits and allow you to respond quickly to changes in performance.
Use reviews to refine strategies, improve operations, and drive revenue growth.
Share reports and dashboards with teams across departments, ensuring everyone is aligned and working with the same data.

User-Friendly Interface
Customizable and flexible
Scalable for All Business Sizes
Comprehensive Insights
Cost-Effective